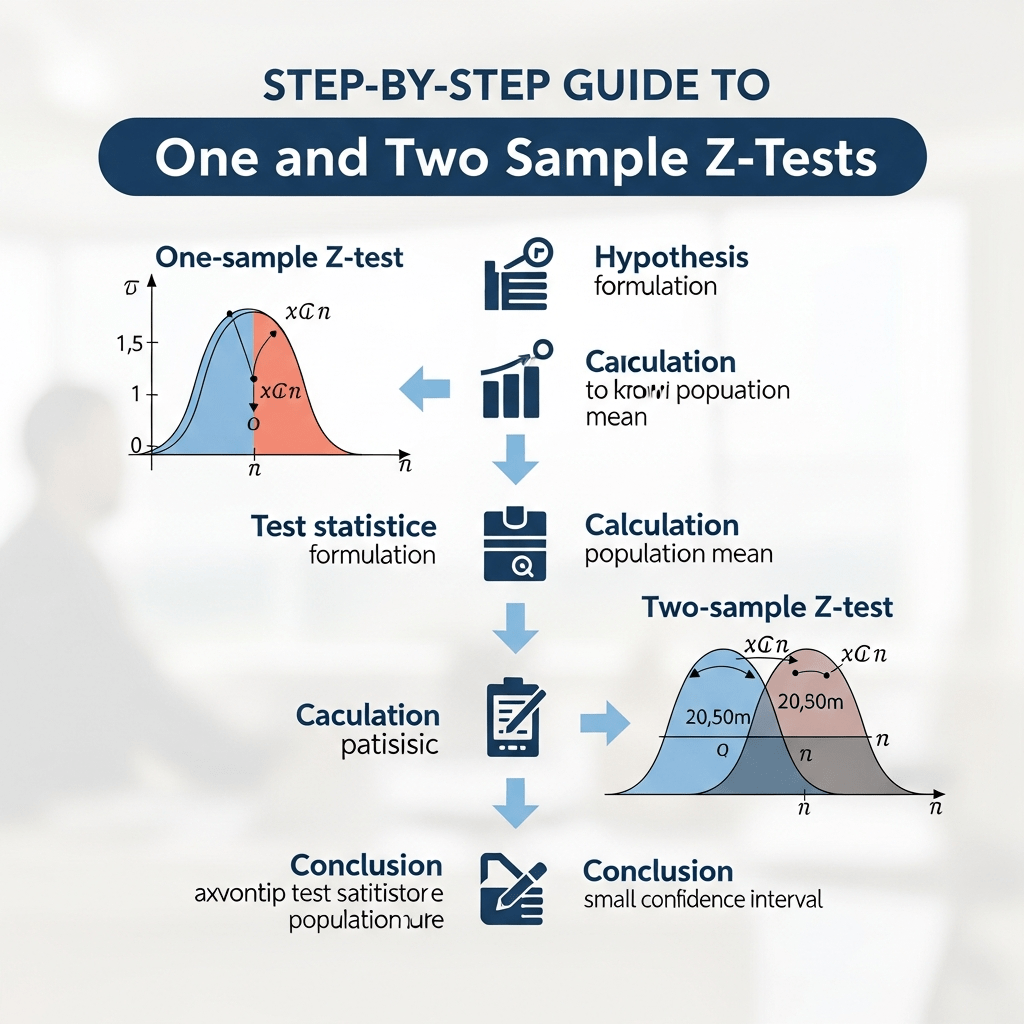
You’ve got data sitting in front of you, and you need to know if what you’re seeing is real or just random noise. That’s where z-tests come in. They’re one of the most practical statistical tools you can learn, and once you get the hang of them, you’ll wonder how you ever made data-driven decisions without them.
This guide walks you through everything you need to know about running one and two sample z-tests. No confusing jargon, no unnecessary complexity. Just clear steps you can follow right now.
What Exactly Is a Z-Test?
A z-test is a statistical test that tells you whether there’s a significant difference between your sample data and what you’d expect. It answers the question: “Is this difference real, or did it just happen by chance?”
Think of it like this. You flip a coin 100 times and get 60 heads. Is the coin unfair, or did you just get lucky? A z-test gives you a mathematical answer.
The test works by calculating a z-score, which measures how many standard deviations your result is from the expected value. The further away it is, the less likely it happened by chance.
Z-tests shine when you have:
- A large sample size (typically 30 or more)
- Data that follows a normal distribution
- Known population standard deviation
If you’re working with smaller samples or don’t know the population parameters, you’d use a t-test instead. But for large datasets with known parameters, z-tests are faster and simpler.
One Sample Z-Tests: Testing Against a Known Standard
A one sample z-test compares your sample mean to a known population mean. You’re checking if your sample is behaving differently than expected.
When to Use It
Let’s say you’re a factory manager. Your machines are supposed to produce widgets weighing 500 grams on average. You measure 50 widgets and find an average weight of 495 grams. Should you recalibrate the machines, or is this normal variation?
Other common uses:
- Testing if student test scores match national averages
- Checking if product dimensions meet specifications
- Verifying if wait times exceed service standards
- Comparing sales performance against targets
What You Need Before Starting
Gather these numbers:
- Sample mean: The average of your measurements
- Population mean: The standard or expected value
- Population standard deviation: How spread out the population data is
- Sample size: How many observations you collected
- Significance level: Usually 0.05 (5% error rate)
The Formula (Don’t Worry, It’s Simple)
The z-score formula looks like this:
z = (sample mean – population mean) / (population standard deviation / √sample size)
The denominator (bottom part) is called the standard error. It accounts for sample size. Bigger samples give more reliable results, so they have smaller standard errors.
Step-by-Step Process
Step 1: Set Up Your Hypotheses
You need two statements:
- Null hypothesis (H0): There’s no difference between your sample and the population
- Alternative hypothesis (H1): There is a difference
For our widget example:
- H0: The machine produces widgets at 500 grams on average
- H1: The machine produces widgets at a different weight
Step 2: Decide on Test Direction
Pick one:
- Two-tailed test: Checks for any difference (higher or lower)
- Left-tailed test: Checks if your sample is significantly lower
- Right-tailed test: Checks if your sample is significantly higher
Use two-tailed unless you have a specific direction in mind. It’s the safest choice.
Step 3: Calculate the Z-Score
Plug your numbers into the formula. Let’s use the widget example:
- Sample mean: 495 grams
- Population mean: 500 grams
- Population SD: 15 grams
- Sample size: 50
z = (495 – 500) / (15 / √50) z = -5 / 2.12 z = -2.36
Step 4: Find the P-Value
The p-value tells you the probability of getting your result by chance. You can look this up in a z-table or use an online calculator.
For z = -2.36 in a two-tailed test, the p-value is about 0.018.
Step 5: Make Your Decision
Compare your p-value to your significance level (0.05):
- If p-value < 0.05: Reject the null hypothesis. Your result is significant.
- If p-value > 0.05: Don’t reject the null hypothesis. Your result could be random chance.
In our case, 0.018 < 0.05, so we reject the null hypothesis. The machines probably need recalibration.
Two Sample Z-Tests: Comparing Two Groups
A two sample z-test compares the means of two independent groups. You’re asking: “Are these two samples actually different from each other?”
When to Use It
You’re running two different marketing campaigns and want to know which performs better. Campaign A reaches 200 people with a 10% conversion rate. Campaign B reaches 180 people with a 14% conversion rate. Is B really better, or just lucky?
Other scenarios:
- Comparing test scores between two teaching methods
- Analyzing sales between two store locations
- Testing product quality from two suppliers
- Measuring customer satisfaction across regions
What You Need
For each sample:
- Sample mean
- Standard deviation
- Sample size
Plus your significance level (usually 0.05).
The Formula
z = (mean1 – mean2) / √[(SD1² / n1) + (SD2² / n2)]
This looks scarier than it is. You’re just comparing the difference in means to the combined variability of both samples.
Step-by-Step Process
Step 1: State Your Hypotheses
- H0: The two population means are equal
- H1: The two population means are different
Step 2: Choose Test Direction
Same as before: two-tailed for any difference, one-tailed if you’re testing a specific direction.
Step 3: Calculate the Z-Score
Let’s use a real example. A coffee shop tests two pricing strategies:
Strategy A (60 days):
- Average daily revenue: $2,800
- Standard deviation: $400
- Sample size: 60
Strategy B (55 days):
- Average daily revenue: $3,100
- Standard deviation: $450
- Sample size: 55
z = (2800 – 3100) / √[(400² / 60) + (450² / 55)] z = -300 / √[2667 + 3682] z = -300 / 79.68 z = -3.77
Step 4: Find Your P-Value
For z = -3.77 in a two-tailed test, the p-value is about 0.0002.
Step 5: Interpret Results
Since 0.0002 < 0.05, we reject the null hypothesis. Strategy B generates significantly higher revenue. Time to implement it permanently.
Understanding P-Values and Significance Levels
This trips people up all the time, so let’s clear it up.
The significance level (alpha) is your threshold for declaring results significant. Setting it at 0.05 means you’re accepting a 5% chance of a false positive (saying there’s a difference when there isn’t).
The p-value is the probability your results happened by chance. Lower p-values mean stronger evidence against the null hypothesis.
Decision rule:
- p-value < 0.05: Results are statistically significant
- p-value > 0.05: Results are not statistically significant
But here’s the catch: statistical significance doesn’t always mean practical significance. You can have a tiny, meaningless difference that’s statistically significant with huge sample sizes. Always consider the real-world impact.
Common Mistakes and How to Avoid Them
Using Z-Tests with Small Samples
Z-tests need large samples (30+) to work properly. With smaller samples, the normal distribution assumption breaks down. Use a t-test instead.
Ignoring Data Distribution
Z-tests assume your data is normally distributed. If your data is heavily skewed or has extreme outliers, results may be misleading. Plot your data first to check.
Picking the Wrong Test Direction
Decide whether you need a one-tailed or two-tailed test before you calculate anything. Changing your mind after seeing results is called p-hacking and invalidates your analysis.
Confusing Standard Deviation Types
For one sample z-tests, use the population standard deviation, not your sample standard deviation. This is a critical difference.
Forgetting About Assumptions
Z-tests assume:
- Random sampling
- Independent observations
- Normal distribution
- Known population parameters
If these don’t hold, your results may be unreliable.
Treating Statistical Significance as Proof
A significant p-value suggests your result probably isn’t random, but it doesn’t prove causation or guarantee importance. Context matters.
Practical Tips for Running Z-Tests
Always Visualize Your Data First
Before running any test, create a histogram or boxplot. You’ll spot outliers, check distribution shape, and get a feel for your data.
Document Everything
Write down your hypotheses, significance level, and test direction before calculating. This prevents bias and keeps your analysis honest.
Use Online Tools When Available
Manual calculations are great for learning, but online calculators save time and reduce errors. If you need a reliable option, check this tool for quick and accurate z-test calculations.
Consider Effect Size
Statistical significance tells you if something is real. Effect size tells you if it matters. A tiny difference might be significant with enough data but too small to care about.
Report Complete Results
Don’t just say “it’s significant.” Report your z-score, p-value, sample sizes, and confidence intervals. This helps others evaluate your findings.
Real-World Application Examples
Example 1: Quality Control in Manufacturing
A pharmaceutical company produces pills with a target weight of 500 mg. Regulations require staying within specifications. They test 100 pills and find an average weight of 498 mg with a known population standard deviation of 5 mg.
Running a two-tailed one sample z-test at 0.05 significance:
- z = (498 – 500) / (5 / √100) = -4.0
- p-value ≈ 0.00006
The pills are significantly underweight. Production needs adjustment.
Example 2: Comparing Teaching Methods
A school tests two teaching approaches. Method A (traditional) is used with 80 students, scoring an average of 75 with SD of 12. Method B (interactive) is used with 75 students, scoring 78 with SD of 11.
Two sample z-test results:
- z = (75 – 78) / √[(144/80) + (121/75)] = -1.71
- p-value ≈ 0.087
Since 0.087 > 0.05, there’s no significant difference. The interactive method doesn’t show clear improvement yet.
Example 3: Marketing Campaign Performance
An online retailer compares two email designs. Design A sent to 500 people gets 8% clicks (SD 2.7%). Design B sent to 450 people gets 11% clicks (SD 3.1%).
Two sample z-test:
- z = (8 – 11) / √[(2.7²/500) + (3.1²/450)] = -15.38
- p-value ≈ 0
Design B crushes it. The improvement is massive and definitely not random.
When to Use Z-Tests vs. Other Tests
Choose a Z-Test When:
- Sample size is 30 or larger
- Population standard deviation is known
- Data is normally distributed
- You’re comparing means
Choose a T-Test When:
- Sample size is small (under 30)
- Population standard deviation is unknown
- You’re estimating from sample data
Choose ANOVA When:
- You’re comparing more than two groups
- You need to test multiple means at once
Choose a Chi-Square Test When:
- You’re working with categorical data
- You’re testing relationships between variables
Making Decisions from Your Results
You’ve run your z-test and got your results. Now what?
If your p-value is below 0.05, you have evidence that your result isn’t just chance. But before making big decisions:
- Check the practical significance. Is the difference large enough to matter?
- Consider costs and benefits. Is acting on this result worth it?
- Look for confounding factors. Could something else explain your results?
- Think about reproducibility. Would you get similar results if you repeated the study?
Statistics guide decisions, but they don’t make them for you. Use your judgment along with the numbers.
Taking Your Next Steps
Z-tests are powerful but straightforward once you practice them a few times. Start with simple examples, work through the calculations by hand to understand what’s happening, then move to calculators for efficiency.
The key is knowing when to use them and how to interpret results correctly. Get those two things right, and you’ve got a tool that’ll serve you well whether you’re in business, research, manufacturing, or any field that deals with data.
Ready to test your own hypotheses? Grab your data, follow these steps, and see what stories your numbers tell. The math works the same whether you’re comparing coffee sales or clinical trial results. You’ve got this.
 Open Mind
Leave a comment